Q2 Market Commentary: A Look Back & Ahead
MODERNIST’S ASSET CLASS INVESTING PORTFOLIOS ARE STRATEGICALLY INVESTED WITH A FOCUS ON LONG-TERM PERFORMANCE OBJECTIVES. PORTFOLIO ALLOCATIONS AND INVESTMENTS ARE NOT ADJUSTED IN RESPONSE TO MARKET NEWS OR ECONOMIC EVENTS; HOWEVER, OUR INVESTMENT COMMITTEE EVALUATES AND REPORTS ON MARKET AND ECONOMIC CONDITIONS TO PROVIDE OUR INVESTORS WITH PERSPECTIVE AND TO PUT PORTFOLIO PERFORMANCE IN PROPER CONTEXT.
As evidence-based investors, we use an approach fueled by data with over 50 years of research, rooted in diversification, and tax conscious investment options. Time has proven the value of investing. While these quarterly market reviews are helpful for staying informed, we also love to remind our clients and community: focus on what you can control, remember the big picture, and stick to your plan.
market snapshot
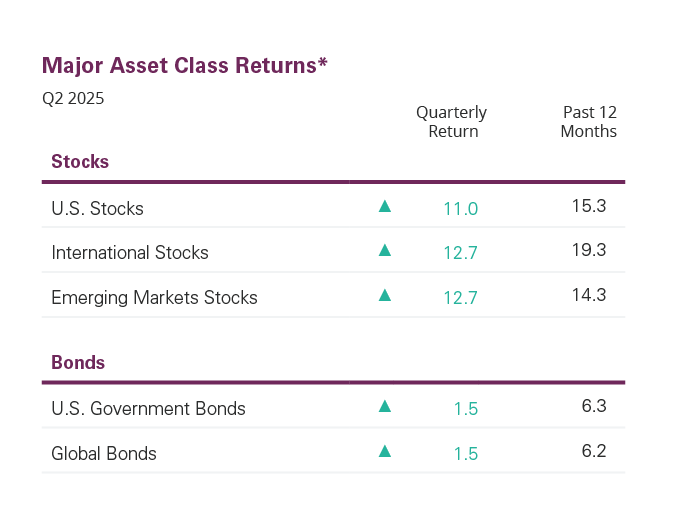
After a difficult start, global equity markets surged in the second quarter, with U.S., international developed, and emerging market stocks all posting strong gains. In the U.S., small-cap value stocks underperformed, trailing the broad market by 6.0%. Internationally, however, small-cap value led the way, outperforming the broader developed markets by 2.1%.
U.S. fixed income also delivered positive returns as interest rates declined late in the quarter driven largely due to growing expectations of future Federal Reserve rate cuts.
Economic Spotlight: Is a Fiscal Storm Brewing?

The current administration’s chaotic tax and policy bill, 2025’s OBBBA, is projected to significantly increase the federal deficit. According to the Congressional Budget Office, the legislation will add $2.4 trillion to the deficit over the next decade. While some argue that stronger economic growth could offset part of that impact, most agree the long-term deficit trajectory remains notably higher. The CBO also emphasizes the link between rising debt and interest rates. Historically, every one percentage point increase in the debt-to-GDP ratio leads to a two basis point rise in long-term Treasury yields—a pattern consistent over the past 20 years.
According to a recent analysis by the Yale Budget Lab, while real GDP growth could see a modest boost of 0.2% annually from 2025 to 2027, starting in the late 2020s, higher debt is expected to raise interest rates, reducing private investment. This would lower real GDP by an estimated 2.9% by 2054 compared to a scenario without the bill. In addition, the 10-year Treasury yield is projected to be 1.2 percentage points higher in 2054 due to the bill’s effects. Factoring in both the bill’s costs and its macroeconomic effects, U.S. debt-to-GDP is expected to reach 183% by 2054. Without the bill, the ratio would rise more moderately—to 142%, driven by pre-existing fiscal pressures.
While the bill may provide a brief boost to growth, it also significantly increases long-term debt risks. Higher debt levels are expected to raise borrowing costs, crowd out private investment, and weigh on future economic output.
A Note From Modernist: It is essential to remember that these economic implications ignore the impact of the offsets that have slashed American social safety net programs that underpin financial planning assumptions and keep many Americans fed, housed, cared for, and educated. To pay for their irresponsible tax bill, this administration has forced through extraordinary cuts that will cause everyone from the upper middle class to the economically vulnerable to suffer: food stamps, Medicaid long term care, children’s medical care and school lunches, HUD housing vouchers, environmental and green energy investments, federal funding for education and libraries and rural hospitals….the list is dishearteningly long and, like future GDP impacts, the impact will balloon as the years accrue.
What can you do? Boycott 47-supporting companies and move your cash to public institutions. Cancel your Amazon, Kindle, Audible subscriptions. Move those dollars to public organizations doing the same work, e.g. Donate monthly to your Library Foundation. Use the library’s free Libby or Kanopy apps to get your ebooks, audio books, and visual media!
slower growth expected amid shifting trade policies
Main Takeaway
Uncertainty around trade policy continues to weigh on the U.S. economy, with signs of slowing emerging in the second half of the year. Real final private demand (GDP less more volatile components such as inventories, trade and government spending) is projected at 0.9% (1), down from 1.9% in Q1. (2) Still, the labor market remains resilient, with unemployment steady at 4.1% (3) and monthly job gains above 100,000 (3), while inflation shows signs of gradual moderation.
Top Risks
In the near term, uncertain trade policy remains the most prominent risk to U.S. markets. Consumer and business confidence continue to weaken, with the Business Roundtable’s CEO Economic Outlook Index falling to 69 (4), well below its historical average of 83, signaling potential headwinds for growth. Over the longer term, widening fiscal deficits are expected to exert upward pressure on interest rates and constrain economic expansion, as rising debt levels increasingly crowd out private investment.
Sources of Stability
Despite signs of slowing, the U.S. economy remains in expansion territory and is expected to avoid recession, according to the Philadelphia Fed’s Second Quarter Survey of 36 professional forecasters. (5) The labor market continues to demonstrate resilience, with monthly job gains consistently exceeding 100,000. Meanwhile, inflation remains above the Fed’s 2% target but is gradually moderating, with the latest CPI reading at 2.4%. (6)
KEY ECONOMIC INDICATORS: AREAS TO WATCH
U.S. Economic Growth
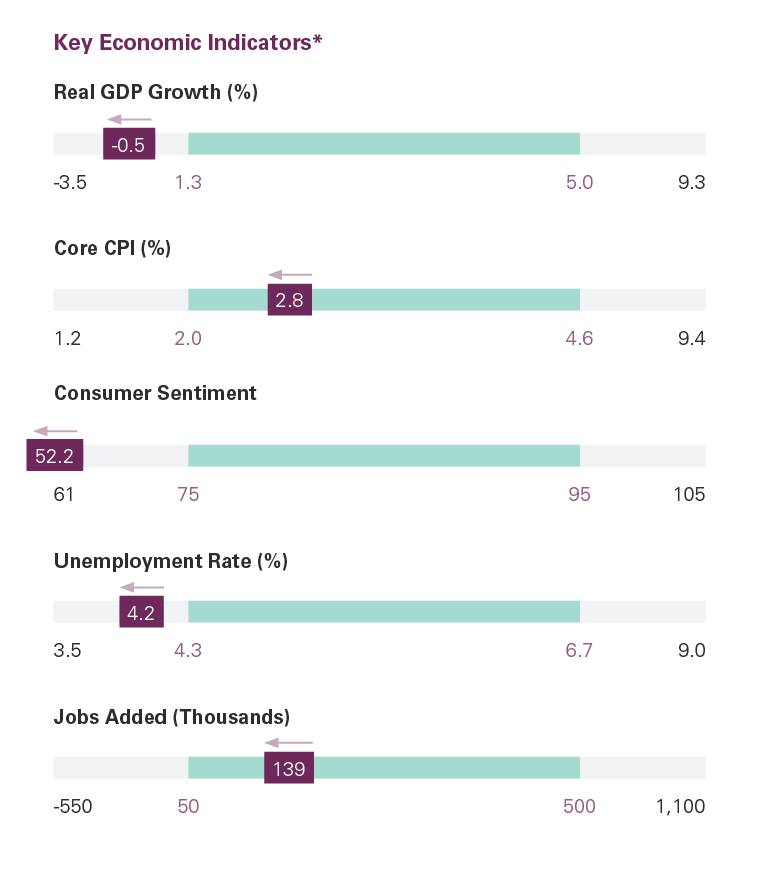
U.S. economic growth was revised down to –0.5% (1) in Q1, largely due to a surge in imports ahead of new tariffs. The Atlanta Fed now projects 2.5% (2) growth in Q2, but much of this rebound reflects trade-related volatility rather than underlying strength. Excluding volatile components like inventories, trade, and government spending, real final private demand rose 1.9% (1) in Q1 and is expected to slow to 0.9% (2) in Q2. Although growth is slowing, the data still shows moderate expansion.
Inflation Trajectory
While inflation remains above the Federal Reserve’s 2% target, recent data has been encouraging. In May, the Consumer Price Index (CPI) rose just 0.1% (4), bringing the year-over-year rate to 2.4%. (4) Food and shelter were the main contributors, each rising 0.3% on the month, equivalent to a 3.9% annualized pace. While shelter costs increased in May, the 3.9% year-over-year gain marks the slowest pace since 2021. That said, the inflation outlook remains highly uncertain amid evolving U.S. tariff policy.
Monetary Policy
The Federal Reserve once again held the federal funds target rate steady at 4.25%–4.50% following its June meeting. The latest dot plot (5) suggests the committee anticipates two rate cuts in 2025, broadly in line with current market expectations. However, the timing of the first cut is uncertain. While Chairman Powell told Congress the committee is “well positioned to wait,” Governors Waller and Bowman, along with Chicago Fed President Goolsbee, have signaled support for a potential cut as early as July.
Fiscal Policy
On May 16, Moody’s delivered a warning to the U.S. government by downgrading its credit rating from Aaa to Aa1. (6) The agency cited weakening budgetary flexibility, noting that mandatory spending, including interest payments, is projected to climb from 73% of total spending in 2024 to 78% by 2035. Moody’s also warned that extending the 2017 Tax Cuts and Jobs Act could add another $4 trillion to the national debt, further straining the fiscal outlook. As a result, federal deficits could swell to nearly 9% of GDP by 2035, up from 6.4% today.
Labor Market
The labor market continues to show resilience, with 139,000 jobs added in May (1) and the unemployment rate holding steady at 4.2%. The May JOLTS report reflected this strength, with job openings rising to 7.8 million (2), a slight decline in layoffs, and an uptick in the quits rate, a key signal of worker confidence. However, not all data was encouraging with ADP reporting a decline of 33,000 (3) private sector jobs in June, and its May estimate was revised down from 37,000 to 29,000, suggesting some softening beneath the surface.
Consumer spending
Consumer spending declined by 0.1% (4) in June, down from 0.2% in April and 0.7% in March, reflecting growing consumer caution. The Conference Board’s Consumer Confidence Index fell 5.4 points to 93.0 (5), while the Expectations Index remained at a recessionary level of 69. (5) Tariffs and inflation were top concerns. However, there was a slight uptick in mentions of easing inflation compared to the previous month, suggesting some early signs of improving sentiment.
Global Economy
Economic growth strengthened in the U.K. and Euro Area, with Q1 real GDP rising 0.7% (6) and 0.3% (6), respectively. In contrast, growth in the far east was more subdued with the Chinese economy slowing to 1.2% while Japan saw its economy shrink 0.2%. (6) In its semiannual report, the World Bank lowered its global growth forecast for 2025 to 2.3%, down from 2.7% in January. (7) If realized, this would mark the slowest expansion in a non-recession year since 2008, with only a "tepid" recovery projected for 2026 and 2027.
Yield Curve
Treasury yields were mixed in Q2, with the 2-year falling 17 basis points, the 10-year holding steady, and the 30-year rising 19 basis points. However, the path was anything but smooth as yields surged from early April through mid-May as shifting trade policy led investors to scale back expectations for Fed rate cuts. More recently, stronger-than-expected economic data has revived the possibility of additional cuts, pushing yields lower toward quarter end.
Thanks to our reliance on long-term evidence-based investing principals, we know that short term data is too noisy to determine our investing choices. Yet, we always like to offer our review of markets because we believe this information should be accessible to all!
Investment Planning Implications
Where do markets go from here?
Resilient U.S. Market. Despite several headwinds, including declining consumer and business confidence and the highest tariffs in nearly a century, the U.S. stock market posted a strong rebound in the second quarter. After falling 4.7% in Q1 (as measured by the Russell 3000), the market surged 11.0% in Q2, bringing the year-to-date return to 5.8%.
International Markets Cooking. International stocks extended their strong performance in Q2, gaining 12.7% and bringing the year-to-date return to 19.3%, as measured by the MSCI World ex-USA IMI Index. With price-to-earnings ratios for developed international markets still below long-term historical averages, the rally may have room to continue in the months ahead.
Decline of the Dollar. Tariff uncertainty and growing fiscal concerns have put significant pressure on the U.S. dollar, driving its value down 10.7% year-to-date, as measured by the ICE U.S. Dollar Index. Despite this sharp decline, the dollar may still be overvalued, with the Real Broad Dollar Index, an inflation-adjusted measure against a wide basket of currencies, standing at 1161, well above its long-term average of 101.
What are the investment planning implications?
Tax-loss harvesting. Amid stock market volatility, we believe it's important to keep tax-loss harvesting at the forefront of portfolio strategy. This technique allows investors to realize capital losses to offset gains elsewhere, effectively reducing overall tax liability. Beyond its immediate tax benefits, tax-loss harvesting supports long-term portfolio discipline and can enhance after-tax returns over time.
Stick with the plan. As highlighted in our Q2 economic commentary, we advised against overreacting to short-term market volatility. Investors who remained disciplined and held their U.S. equity positions were rewarded with an impressive 11.0% return for the quarter. In contrast, those who shifted to cash earned just 1.1%, based on the ICE BofA U.S. One Month Treasury Bill Index, underscoring the potential cost of reactionary decision-making.
Rebalancing is key. Strong Q2 performance across equity markets may have pushed portfolio allocations off target. Periodic rebalancing remains a simple but powerful tool to manage risk, maintain strategic alignment, and lock in gains from outperforming areas.