MODERNIST’S ASSET CLASS INVESTING PORTFOLIOS ARE STRATEGICALLY INVESTED WITH A FOCUS ON LONG-TERM PERFORMANCE OBJECTIVES. PORTFOLIO ALLOCATIONS AND INVESTMENTS ARE NOT ADJUSTED IN RESPONSE TO MARKET NEWS OR ECONOMIC EVENTS; HOWEVER, OUR INVESTMENT COMMITTEE EVALUATES AND REPORTS ON MARKET AND ECONOMIC CONDITIONS TO PROVIDE OUR INVESTORS WITH PERSPECTIVE AND TO PUT PORTFOLIO PERFORMANCE IN PROPER CONTEXT.
As evidence-based investors, we use an approach fueled by data with over 50 years of research, rooted in diversification, and tax conscious investment options. Time has proven the value of investing. While these quarterly market reviews are helpful for staying informed, we also love to remind our clients and community: focus on what you can control, remember the big picture, and stick to your plan.
market snapshot
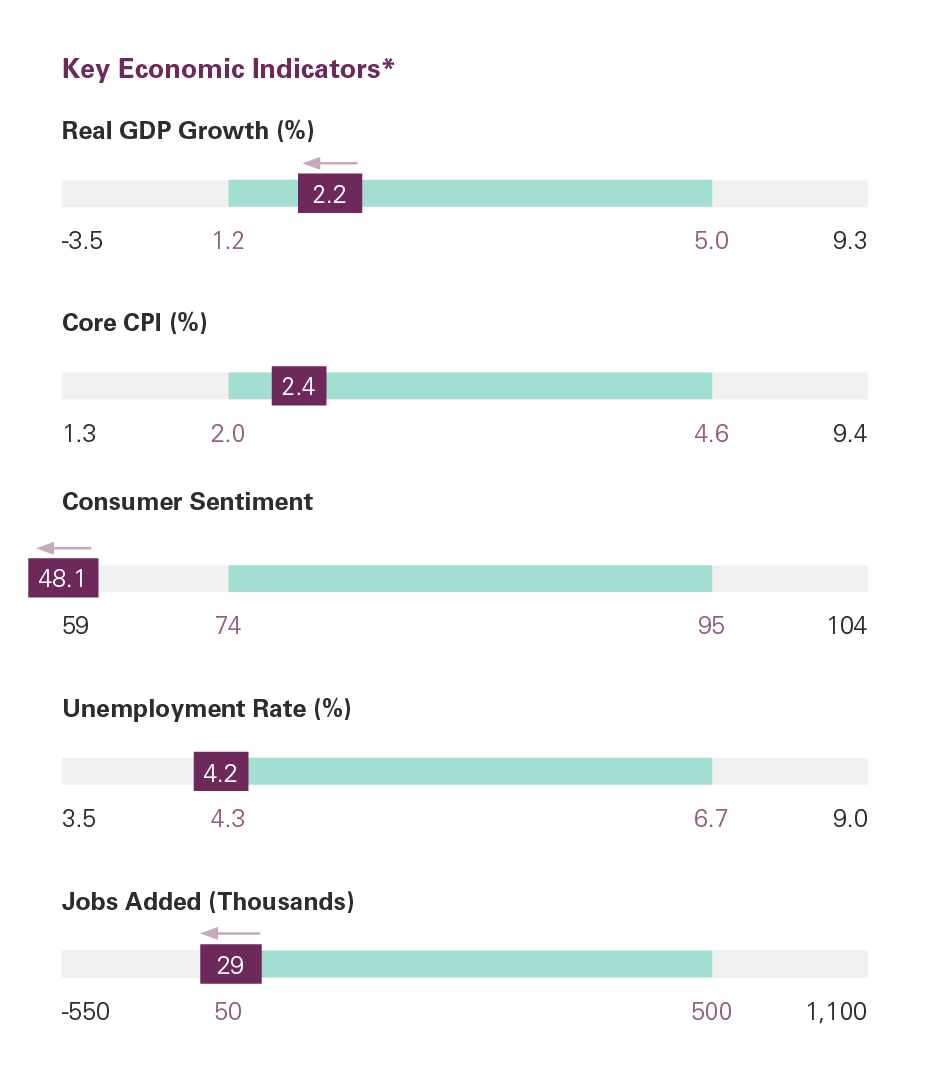
Equity markets cooled noticeably in Q3. U.S. stocks rose 1.4% (Russell 3000), led primarily by energy and software. Developed international markets gained 1.2% (MSCI World ex-USA IMI), as strength in Japan, driven by earnings, buybacks, and governance reforms, offset weakness in Europe, where rising yields and energy prices weighed on investor sentiment. Emerging markets slipped 0.3% (MSCI EM IMI), weighed down by July's global semiconductor sell-off.
U.S. fixed income fell 3.5% (Bloomberg U.S. Aggregate), pressured by higher inflation, a rising term premium, and a more hawkish Fed under Chairman Warsh.
Economic Spotlight:
What $40 Trillion in Debt means for your portfolio
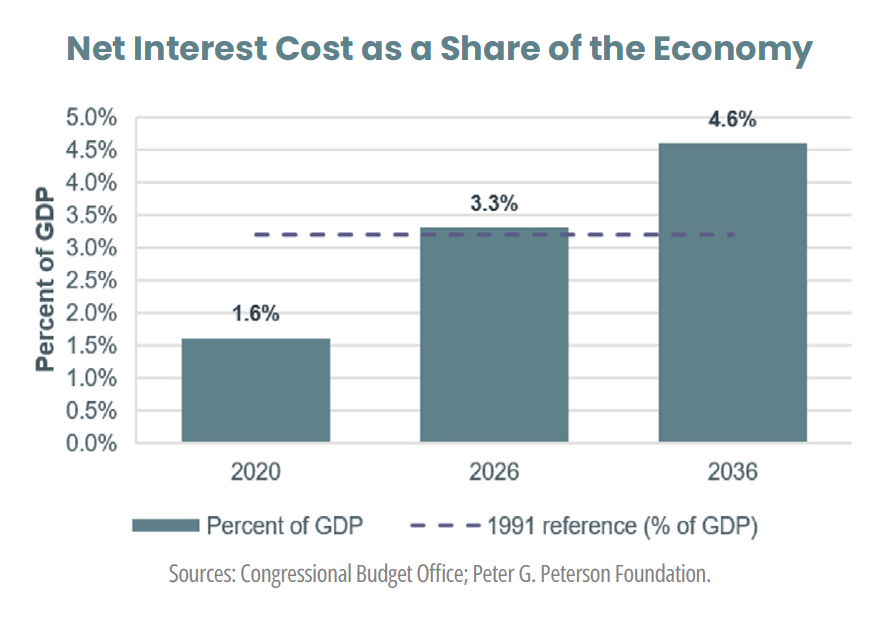
The U.S. national debt passed $40 trillion in August, but the cost of carrying that debt matters more than its size. As older, low-rate bonds mature and are refinanced at higher rates, the average rate on outstanding Treasury debt has more than doubled from 1.5% five years ago. Together with debt growing from roughly $28 trillion to $40 trillion, this has pushed net interest costs to 3.3% of GDP, above the 1991 postwar high. The Congressional Budget Office projects annual net interest costs will more than double between 2026 and 2036.
Debt held by the public, which most economists consider the more meaningful measure, is 101% of GDP today and is projected to reach 120% by 2036, passing the 1946 record of 106%. Gross federal debt, which also counts what the government owes itself, is 123% of GDP and projected to reach 136%. Research by Elmendorf, Hubbard, and Liscow found that growth alone is very unlikely to stabilize the debt. Faster growth can reduce, but not replace, the tax increases or spending cuts eventually needed.
Because Treasury yields set the baseline for most other borrowing, higher rates ripple across the economy. In August, the 30-year Treasury yield closed at 5.25%, its highest level since 2007, and the 30-year TIPS yield closed at 2.95%, the highest since 30-year TIPS issuance began in 2010. With market-implied inflation expectations steady at about 2.3%, higher rates mainly reflect investors demanding higher real yields. As a result, bonds now offer higher expected returns than at any point in the last 15 years.
High debt has not been a reliable signal to reduce stock exposure. Dimensional Fund Advisors examined 153 instances since 1975 in which a country's debt exceeded 100% of output and found stocks were positive about two-thirds of the time.
A well-built portfolio should account for debt-related risks by weighing exposure to interest rates, credit, and unexpected inflation. Longer-duration bonds carry more interest rate risk, and lower-quality bonds tend to move with stocks in market stress. Investors concerned about unexpectedly high inflation may consider TIPS or commodities, which have historically held up well in those periods. The debt is a real long-term problem, but it is not a reason to abandon your plan.
a more hawkish fed, a resilient economy
Main Takeaway
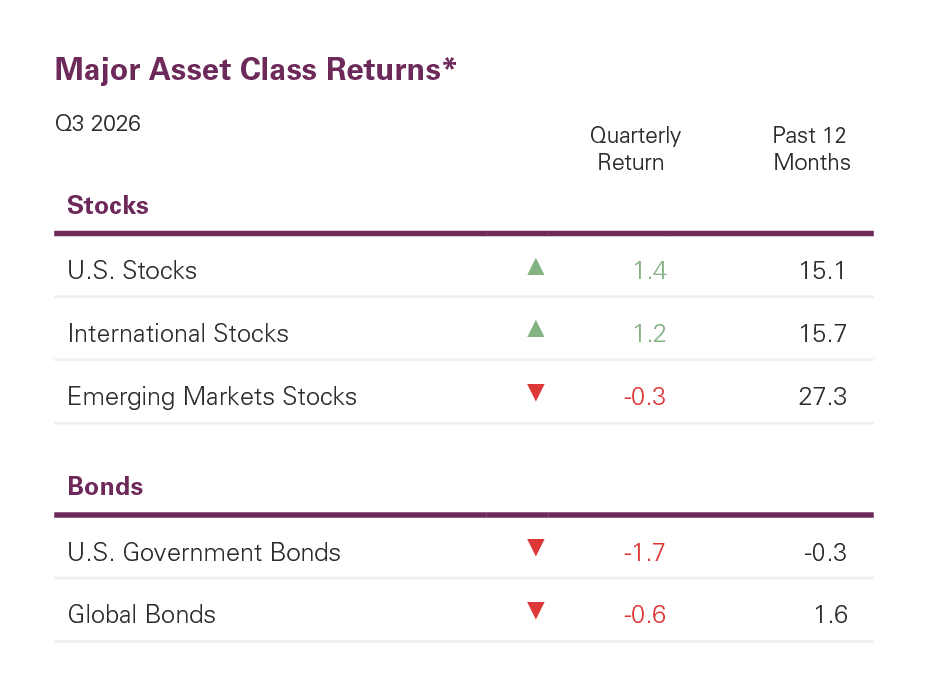
U.S. growth slowed modestly to a 2.2% annualized rate¹ in Q2, though underlying private demand remained robust and early Q3 data suggest momentum carried forward. The labor market has softened, with employers adding just 152,000 jobs² over the past three months. With headline inflation well above target and energy prices elevated, the Fed raised rates for the first time since 2023, a clear hawkish shift under Chairman Kevin Warsh.
Top Risks
Headline inflation remains well above the Fed's 2% target, and a hotter-than expected core reading helped push the Fed to its first rate hike since 2023, with one more expected this year. A prolonged Strait of Hormuz disruption could keep energy prices elevated, fueling inflation while weighing on growth. Job growth slowed in Q3, and while the economy continues to expand, more restrictive monetary policy is clouding the outlook for growth.
Sources of Stability
Despite a modest slowdown in Q2, the U.S. economy remains resilient. Real GDP grew at a 2.2% annualized pace, while real final sales to private domestic purchasers rose a robust 4.6% (1), underscoring healthy underlying demand. The Atlanta Fed's GDPNow model projects Q3 growth near 3.7% (3). Job growth has cooled but stayed positive, with 152,000 jobs added in Q3, and unemployment remains low at 4.2% (2) despite a slight uptick in September.
KEY ECONOMIC INDICATORS: AREAS TO WATCH
U.S. Economic Growth
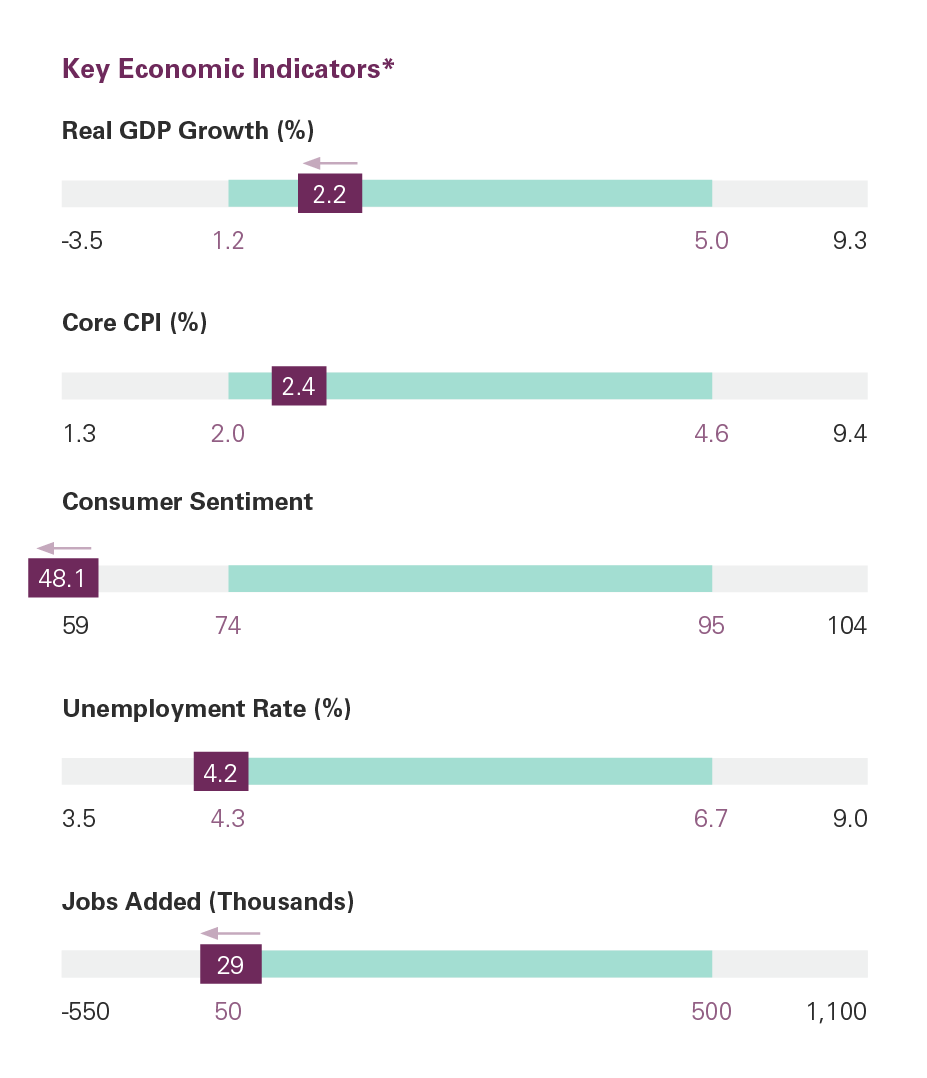
The U.S. economy rose at a 2.2% (1) annualized rate in Q2 2026, down slightly from 2.5% pace in Q1. Second quarter growth was driven by consumer spending, investment, and export growth. Underlying demand remained strong, with real final sales to private domestic purchasers rising 4.6%, up from 1.8% in Q1 and above the four-quarter average of 2.9%. Looking ahead, the Atlanta Fed’s GDPNow model projects Q3 GDP growth of approximately 3.7%2, while real final sales to private domestic purchasers are tracking near 3.8%, pointing to continued private-sector strength.
Inflation Trajectory
Headline CPI rose 0.4% in August (3) and 3.4% year-over-year, both in line with expectations, driven largely by a 16.3% increase in energy prices over the past 12 months. Core CPI rose 0.3%, a tenth above expectations, while the annual rate eased to 2.4%, its lowest since March 2021. Airfares and hotels led the pickup. The higher-than-expected core reading added to the case for the Fed’s September rate hike. Meanwhile, the renewed rise in oil, gasoline, and diesel prices risks filtering through to other goods and services and lifting inflation expectations.
Monetary Policy
As expected, the Federal Reserve raised the federal funds rate by 25 basis points to 3.75%–4.00% at its September meeting, its first increase since 2023. The Summary of Economic Projections (dot plot) shows the median committee member expecting one more hike in 2026 (4) and a hold in 2027. The move reflects a clear hawkish shift under Chairman Warsh. In his press conference, he emphasized that, “our predominant focus is on the price-stability side of our mandate” and that “inflation risks are to the upside.”
yield curve changes
U.S. interest rates rose across the curve in Q3, with 2-, 10-, and 30-year Treasury yields up 74, 85, and 73 basis points. The increase reflects a “perfect storm” of rising debt-to-GDP ratio lifting the term premium, massive AI-related capital spending financed through increased borrowing, and energy supply shocks from the Ukraine and Strait of Hormuz conflicts. Long-term Treasury yields have reached their highest levels since before the Global Financial Crisis, offering bond investors more attractive income opportunities while raising borrowing costs for households, businesses, and the federal government.
Labor Market
Employers added just 152,000 jobs in Q3, down from 242,000 in Q2. September's employment report was weaker than expected, with payrolls rising only 29,000 (1) against a consensus of 84,000 and a prior 12-month average of 45,000. July and August were revised down by a combined 60,000, leaving July in negative territory. The unemployment rate rose 0.1 percentage point to 4.2% as labor force participation increased to 61.8%. Still, participation remains 0.3 points below January, and Conference Board and New York Fed surveys show workers remain pessimistic about job prospects.
Consumer spending
Consumer spending rebounded strongly in Q2, rising at a 3.8% annualized rate (2), up from 0.7% in Q1 and above the 2.1% four-quarter average. Spending appears to be holding up in Q3, with Bank of America card data (3) showing spending up 3.7% excluding gasoline, roughly 2.5 times the 2025 pace. The Atlanta Fed projects Q3 consumer spending growth of approximately 2.3%. Consumers continue to spend despite higher energy prices and renewed trade tensions, which have pushed consumer sentiment near its five-year low.
Global Economy
Growth was positive across major economies in Q2. U.K. GDP grew at a 1.6%⁵ annualized pace, down from 2.4% in Q1, while the Euro Area rebounded to 2.4%⁵ after a flat Q1. In Asia, China expanded at a 3.6% (5) annualized rate and Japan at 1.4% (5). Looking ahead, the OECD projects global GDP growth of 2.9% (6) in 2026 and 3.0% in 2027 (6). Stronger price pressures, weaker real income growth, and higher interest rates may moderate near-term momentum, but robust AI-related activity should help activity strengthen through 2027.
PRIVATE CREDIT
According to the Cliffwater Direct Lending Index (CDLI), unrealized losses have eroded private credit performance by roughly 140 bps through Q27. Software loans account for about two-thirds of those losses, reflecting AI disruption concerns more than deteriorating fundamentals, with 2020-2021 loans hit hardest. Other major sectors experienced less than 100 bps of price declines. Overall credit quality remains stable, with realized losses totaling just 47 bps over the past four quarters. Historically, mark-to-market declines have often exceeded subsequent realized losses, suggesting current marks may be overly conservative.
Thanks to our reliance on long-term evidence-based investing principals, we know that short term data is too noisy to determine our investing choices. Yet, we always like to offer our review of markets because we believe this information should be accessible to all!
Investment Planning Implications
Where do markets go from here?
Stretched Valuations. U.S. large-cap stocks remain richly valued, trading at roughly 31 times earnings versus a long-term average of 17.7. By contrast, valuations for U.S. small-cap and developed ex-U.S. stocks sit much closer to their historical averages, which may present more attractive opportunities.
Mid-Term Elections. Investors naturally want to look for a connection between who wins control of Congress and how markets are expected to perform. Looking at almost a century worth of returns shows that stocks have trended upward no matter which party controls the legislature. We strongly recommend against making any portfolio changes based on election results.
Higher For Longer. In September, the Fed raised rates 25 basis points to 3.75%–4.00%, its first hike since 2023, with one more expected this year. Higher rates can weigh on equity valuations by increasing the discount rate applied to future earnings, particularly for growth stocks. Higher borrowing costs may also pressure profits, leaving markets sensitive to further hikes.
What are the investment planning implications?
Higher Yields Are an Opportunity. With yields rising to levels not seen since prior to the Great Financial Crisis (GFC), this could be an opportune time to reassess your willingness, ability, and need to take risk. Higher bond yields could allow you to dial back risk in your portfolios while still meeting your investment goals.
Bond Correlations Rising. With federal debt above 100% of GDP, fiscal concerns could keep long-term yields elevated, or even push them higher during a recession, weakening fixed income's role as an equity hedge. To address this, investors may consider diversifying that protection with market neutral alternative strategies that are uncorrelated to macroeconomic risks.
Quickly Changing Leadership. Q3 showed how quickly market leadership can shift. Semiconductors, the AI winners that powered second-quarter gains, cooled, while software stocks, earlier viewed as AI losers, rebounded. In July and August alone, software rose 25% as semiconductors fell 4%. Rather than chasing recent winners, investors are better served by staying broadly diversified across sectors, styles, and themes.
For informational and educational purposes only and should be construed as specific investment, accounting, legal or tax advice. Certain information is based on third party data and may become outdated or otherwise superseded without notice. Third party information is deemed to be reliable, but its accuracy and completeness cannot be guaranteed. Indexes are unmanaged baskets of securities that are not available for direct investment by investors. Index performance does not reflect the expenses associated with the management of an actual portfolio. Past performance is not a guarantee of future results. Foreign securities involve additional risks, including foreign currency changes, political risks, foreign taxes, and different methods of accounting and financial reporting. Emerging markets involve additional risks, including, but not limited to, currency fluctuation, political instability, foreign taxes, and different methods of accounting and financial reporting. All investments involve risk, including the loss of principal, and cannot be guaranteed against loss by a bank, custodian, or any other financial institution.