
Q3 Market Commentary: A Look Back & Ahead
MODERNIST’S ASSET CLASS INVESTING PORTFOLIOS ARE STRATEGICALLY INVESTED WITH A FOCUS ON LONG-TERM PERFORMANCE OBJECTIVES. PORTFOLIO ALLOCATIONS AND INVESTMENTS ARE NOT ADJUSTED IN RESPONSE TO MARKET NEWS OR ECONOMIC EVENTS; HOWEVER, OUR INVESTMENT COMMITTEE EVALUATES AND REPORTS ON MARKET AND ECONOMIC CONDITIONS TO PROVIDE OUR INVESTORS WITH PERSPECTIVE AND TO PUT PORTFOLIO PERFORMANCE IN PROPER CONTEXT.
As evidence-based investors, we use an approach fueled by data with over 50 years of research, rooted in diversification, and tax conscious investment options. Time has proven the value of investing. While these quarterly market reviews are helpful for staying informed, we also love to remind our clients and community: focus on what you can control, remember the big picture, and stick to your plan.
market snapshot
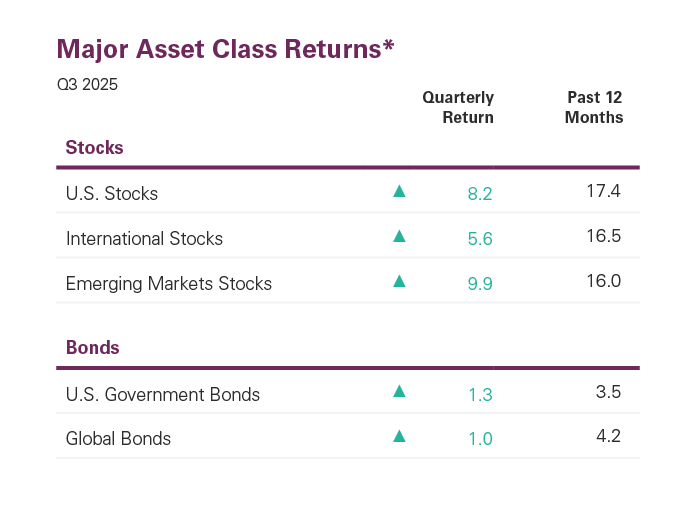
Global equity markets continued to rally in the third quarter, with U.S., international developed, and emerging market stocks all posting strong gains. In the U.S., small-cap stocks roared back, with the Russell 2000 Index up 12.4% for the quarter, outperforming the broad market (Russell 3000 Index) by 4.2%. Internationally, results were mixed as developed markets lagged the U.S., while emerging markets outperformed.
U.S. fixed income also delivered positive returns as interest rates moved lower, driven largely by rising expectations for Federal Reserve rate cuts, which materialized in September.
Economic Spotlight: Diverging Economic and Labor Data

The latest Q2 GDP data showed the economy accelerating to 3.8% (1) despite lingering headwinds. This strength appears inconsistent with the slowdown in employment growth over the same period. It may seem contradictory for the economy to expand while the labor market weakens, but recent analysis from RBC helps explain what’s happening beneath the surface:
Shifting Demographics: The U.S. is in peak retirement years, with the 65+ population growing rapidly through the 2020s. Replacing retirees doesn’t count as “new” job creation, masking underlying labor demand.
Immigration: Stricter policies since early 2025 have slowed labor force growth, keeping the job market tight.
Productivity Growth: The rise of AI has boosted productivity to levels not seen since the 1990s, allowing the economy to grow with fewer new hires.
These trends indicate that the U.S. no longer needs to create as many jobs to keep unemployment stable. The San Francisco Fed estimates the breakeven employment growth rate at 70,000–90,000 jobs per month, but it may now be even lower. Payroll prints below that range should therefore not be viewed as harshly, and in the near term, payroll growth may be a less reliable indicator of labor market strength.
Job Growth Slows in the Face of Strong Growth
Main Takeaway
A cooling job market has shifted the conversation about the overall strength of the U.S. economy, prompting the Federal Reserve to cut interest rates. Job growth slowed sharply in Q3, averaging just 27,000 (1) per month from May through August, though the unemployment rate has held steady at 4.3%. (1) Despite softer labor conditions, economic growth has recently accelerated, while inflation has begun trending higher in recent months.
Top Risks
The job market is raising fresh concerns about the health of the U.S. economy. August added just 22,000 jobs, (1) while payroll figures for May and June were revised sharply lower. Consumer sentiment is also weakening, with the University of Michigan Consumer Sentiment Index falling to 55.4 in September, (2) its lowest since May and 21% below its level a year earlier. Meanwhile, inflation remains a concern, with recent readings trending higher.
Sources of Stability
The U.S. economy strengthened in Q2 and is on pace to expand at a 3.8% annualized rate in Q3.3 Consumer spending, which accounts for nearly two-thirds of GDP, remains resilient and is projected to rise 2.2% in Q3, (3) supported by easing trade uncertainty and a more accommodative monetary stance. While job growth has cooled, unemployment remains low at 4.3%, (1) and recession odds have fallen to 20%. (4)
KEY ECONOMIC INDICATORS: AREAS TO WATCH
U.S. Economic Growth

U.S. economic growth rebounded to 3.8% in Q2, (1) supported by a decline in imports and stronger consumer spending. Excluding volatile components such as inventories, trade, and government spending, real final sales to private domestic purchasers rose 2.9%, up from 1.9% in Q1. The Atlanta Fed projects Q3 GDP growth of 3.8% (2), with real final sales to private domestic purchasers easing slightly to 2.6%. The data suggest growth has accelerated, with momentum pointing to continued expansion in the near term.
Inflation Trajectory
Inflation remains above the Fed's 2% target, with signs of renewed upward momentum. In August, the Consumer Price Index (CPI) rose 0.4%, (3) pushing the year-over-year rate to 2.9%, the fastest pace since January and above market expectations. The increase was driven by higher prices for staples such as food and electricity, while tariffs likely added pressure to goods like clothing and household furnishings. Inflation is likely to remain uncertain but could continue to accelerate in the near term given U.S. tariff policy.
Monetary Policy
As expected, the Fed lowered the federal funds target rate by 25 basis points to a range of 4.00%–4.25% following its September meeting. The updated dot plot (4) shows the committee anticipates two additional rate cuts in 2025, broadly in line with market expectations. In later remarks, Chair Powell noted that a cooling labor market was a key factor in the decision, while also cautioning that “near-term risks to inflation are tilted to the upside and risks to employment to the downside—a challenging situation.”
government shutdown
Government shutdowns usually generate more noise than real impact. Since 1976, there have been 21 shutdowns, (5) with 10 lasting more than five days. Markets have typically ignored short standoffs and barely reacted to longer ones. The lone exception was the 2018–19 episode, when stocks were already rebounding from late-2018 lows. Extended shutdowns can dent tourism around national parks, but the effect has never been large enough to move GDP. Retroactive pay for federal workers has also cushioned household spending in past episodes.
Labor Market
The labor market is showing signs of strain. In August, the U.S. economy added only 22,000 jobs, (1) while the unemployment rate edged up to 4.3%. More importantly, May and June payrolls were revised down by a combined 280,000, highlighting that job growth has been weaker than initially reported. The softness was echoed in the August JOLTS report (2) where job openings ticked up modestly but remain near March lows, and the openings-to-workers ratio fell to 0.98, the lowest since April 2021.
Consumer spending
Consumer spending remained resilient in August, rising 0.6% (3) after gains of 0.5% in both June and July. At the same time, sentiment softened in September, with the University of Michigan Consumer Sentiment Index slipping to 55.1 from 58.2, (4) though still above April and May lows. Expectations weakened across the board and consumers grew more pessimistic about labor markets, business conditions, and their own incomes and finances. Persistent frustration with elevated prices continues to weigh on household confidence despite steady spending.
Global Economy
Economic growth slowed across Europe in Q2, with U.K. real GDP expanding just 0.3% (5) and the euro area barely positive at 0.1%. (5) In Asia, the picture was more mixed. China’s economy decelerated to 1.1% growth, (5) reflecting weaker demand and policy headwinds, while Japan posted a modest acceleration to 0.5%. (5) Against this backdrop, the International Monetary Fund raised its global growth forecast (6) for 2025 by 0.2% to 3.0% and nudged its 2026 projection up to 3.1% from 3.0% in April, though downside risks remain elevated.
Yield Curve
Treasury yields declined over Q3, with the 2-year down 12 bps to 3.60%, the 10-year off 8 bps to 4.16%, and the 30-year lower by 5 bps to 4.73%. The path, however, was uneven with yields spiking in mid-July on stronger economic data and the Fed’s decision to hold rates steady. In the latter half of the quarter, softer jobs data renewed expectations for additional easing, culminating in the Fed cutting the target rate at its September meeting.
Thanks to our reliance on long-term evidence-based investing principals, we know that short term data is too noisy to determine our investing choices. Yet, we always like to offer our review of markets because we believe this information should be accessible to all!
Investment Planning Implications
Where do markets go from here?
Small Cap Resurgence. With the backdrop of looming Fed interest rate cuts, small-cap stocks rallied in Q3 posting a healthy 12.4% gain as measured by the Russell 2000 index. Falling rates tend to benefit small-cap stocks as they tend to rely more heavily on floating-rate debt than large-caps. As borrowing costs decline, small-caps should see a meaningful tailwind to earnings.
Stretched Valuations in U.S. Markets. AI continues to drive U.S. equity market performance in 2025, pushing valuations toward tech-bubble territory. As of August 31, the U.S. equity market traded at a P/E ratio of 28.4, (1) well above its long-term average of 17.3 (1) and approaching the March 2020 peak of 31.4. (1) Notably, company earnings growth has been well above expectations, providing at least short-term support for the high valuation levels.
Interest Rate Volatility. Given the current economic backdrop, data dependence is heightened. Upcoming jobs reports, inflation releases, and Fed commentary could serve as key volatility triggers, sparking significant repricing of expected rate cuts in both timing and magnitude.
What are the investment planning implications?
Investing After New Market Highs. New market highs can trigger familiar concerns. Investors worry they’ve missed the rally and that buying now is more of a risk. Historically, buying at a market high has not been the mistake investors assume it is. In fact, forward returns following new highs have outpaced those from randomly timed investments. On average, investors have been better off putting capital to work during market highs than sitting in cash and waiting for a pullback.
Managing Inflation Risk. With the Fed beginning to ease, rising fiscal deficits worldwide, and deglobalization potentially reversing decades of disinflationary trends, investors concerned about upside inflation risks should consider an allocation to real assets to help preserve purchasing power.

For informational and educational purposes only and should be construed as specific investment, accounting, legal or tax advice. Certain information is based on third party data and may become outdated or otherwise superseded without notice. Third party information is deemed to be reliable, but its accuracy and completeness cannot be guaranteed. Indexes are unmanaged baskets of securities that are not available for direct investment by investors. Index performance does not reflect the expenses associated with the management of an actual portfolio. Past performance is not a guarantee of future results. Foreign securities involve additional risks, including foreign currency changes, political risks, foreign taxes, and different methods of accounting and financial reporting. Emerging markets involve additional risks, including, but not limited to, currency fluctuation, political instability, foreign taxes, and different methods of accounting and financial reporting. All investments involve risk, including the loss of principal, and cannot be guaranteed against loss by a bank, custodian, or any other financial institution.
